Which Renewable Energy Source Has the Highest Pollution Impact?
 Oct, 20 2025
Renewable Energy Pollution Comparison Tool
Compare the environmental impact of different renewable energy sources based on lifecycle assessment metrics. This tool helps visualize the pollution differences between solar, wind, hydropower, biomass, and geothermal energy.
Select Energy Sources to Compare
Comparison Results
| Energy Source | CO₂e (g/kWh) | Water Use (L/kWh) | Land Use (m²/kWh) | Pollution Score |
|---|
Select at least one energy source to see comparison results.
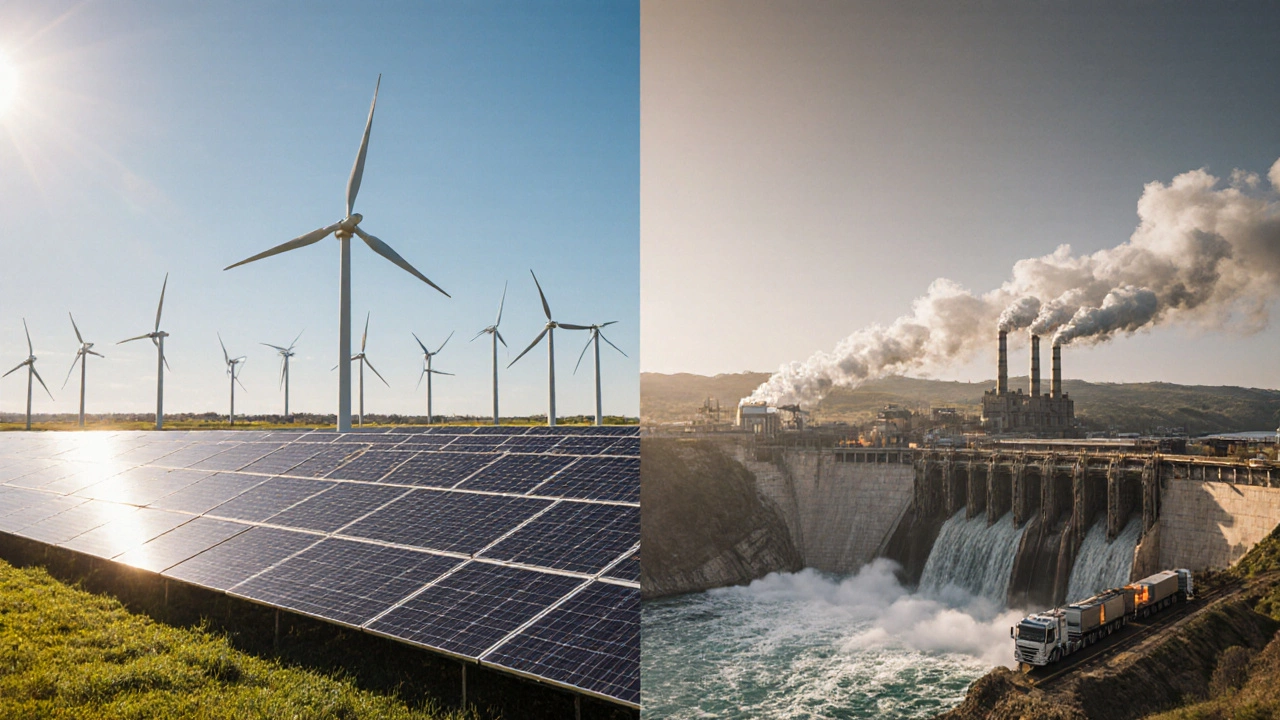
When we hear the word “renewable,” we instantly picture clean solar panels and wind turbines humming above a green field. But not every green‑energy source is equally gentle on the planet. Understanding the most polluting renewable energy helps policymakers, investors, and everyday citizens make smarter choices about the clean transition.
How We Measure Pollution in Renewable Energy
People often compare energy sources by looking at the carbon dioxide released while the plant is running. That’s only part of the story. A full Lifecycle Assessment is a systematic accounting of all greenhouse gas (GHG) emissions, water use, land disturbance, and other environmental impacts from “cradle to grave.” In practice, analysts break down a renewable technology into three stages:
- Manufacturing and construction: extracting raw materials, fabricating components, and building the facility.
- Operation: the energy generated versus any emissions from maintenance or ancillary fuels.
- Decommissioning: dismantling equipment, recycling materials, and site restoration.
Key metrics include:
- CO₂‑equivalent emissions per kilowatt‑hour (g CO₂e/kWh)
- Water consumption (liters per kWh)
- Land footprint (square meters per kWh)
- Additional pollutants such as methane (CH₄) and nitrous oxide (N₂O)
By normalising these numbers, we can line up all renewables on a level playing field.
Quick Snapshot of Major Renewable Sources
Below is a high‑level view of the most common renewables and their typical environmental footprints.
| Renewable Source | CO₂e (g/kWh) | Water Use (L/kWh) | Land Use (m²/kWh) | Typical Issues |
|---|---|---|---|---|
| Solar Photovoltaic | 20‑50 | 0‑2 | 5‑10 | Silicon mining, end‑of‑life waste |
| Onshore Wind | 10‑20 | 0‑1 | 2‑5 | Visual impact, turbine blade disposal |
| Hydropower (large dams) | 30‑120 | 5‑30 | 0‑2 (reservoir area) | Methane from flooded biomass, ecosystem loss |
| Biomass (combustion) | 70‑250 | 1‑4 | 10‑50 | Land‑use change, air pollutants, supply chain emissions |
| Geothermal (dry steam) | 5‑15 | 0‑0.5 | 1‑3 | Induced seismicity, mineral scaling |
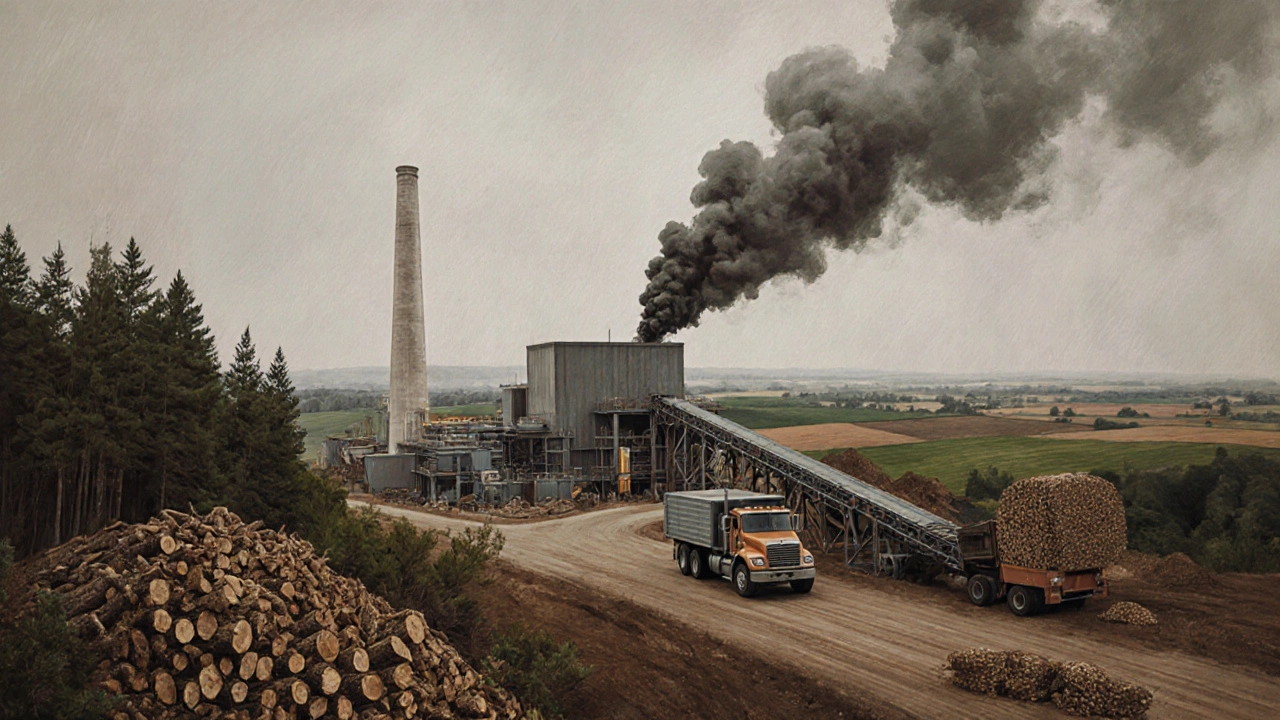
Why Biomass Often Tops the Pollution List
When people think of “green,” they sometimes picture burning wood pellets or agricultural waste. In a Biomass Energy system, the carbon stored in plants is released back into the atmosphere when the material is combusted. If new plants grow fast enough to re‑absorb that CO₂, the cycle can be carbon‑neutral - but that assumption rarely holds in real life.
Key pollution drivers for biomass:
- Direct combustion emissions: CO₂, methane, and nitrous oxide are emitted during burning.
- Land‑use change: Converting forests or natural grasslands into energy crops releases huge carbon stores.
- Supply‑chain losses: Transporting bulky feedstock consumes diesel and adds extra emissions.
- Particulate matter: Small‑scale stove use in developing regions contributes to severe air‑quality problems.
Studies from the International Energy Agency (IEA, 2024) show that modern, responsibly sourced biomass can hover around 70 g CO₂e/kWh, but poorly managed feedstock pushes the number above 200 g CO₂e/kWh - well above wind or solar.
Large‑Scale Hydropower: A Hidden Methane Source
Huge dams are often celebrated as the “cleanest” energy, but they hide a potent greenhouse gas: methane. When a valley is flooded, plant material decomposes anaerobically, producing methane that bubbles up to the surface. In tropical reservoirs, methane emissions can rival or even exceed the CO₂ avoided by displacing fossil fuels.
Factors that amplify methane release:
- Warm water temperatures (tropics) accelerate microbial activity.
- Shallow reservoirs with high organic matter content.
- Frequent water level fluctuations that expose and re‑submerge sediments.
Lifecycle analyses (LCA) from the World Resources Institute (2023) report average emissions of 70‑120 g CO₂e/kWh for large dams, with some tropical projects climbing above 200 g CO₂e/kWh due to methane. That places them in the same ballpark as the dirtiest biomass plants.
Solar, Wind, and Geothermal: The Low‑Pollution Leaders
Solar photovoltaics and onshore wind consistently score under 30 g CO₂e/kWh in modern LCAs. Their manufacturing footprints are front‑loaded, but once erected they emit virtually nothing during operation. Geothermal dry‑steam plants can beat even solar with emissions as low as 5 g CO₂e/kWh, though they’re limited to tectonically active regions.
Water use is another differentiator. Solar panels need little to no water for cooling, while some concentrated solar‑thermal (CST) plants consume up to 500 L/kWh. Wind turbines draw almost no water at all, making them ideal for arid regions.
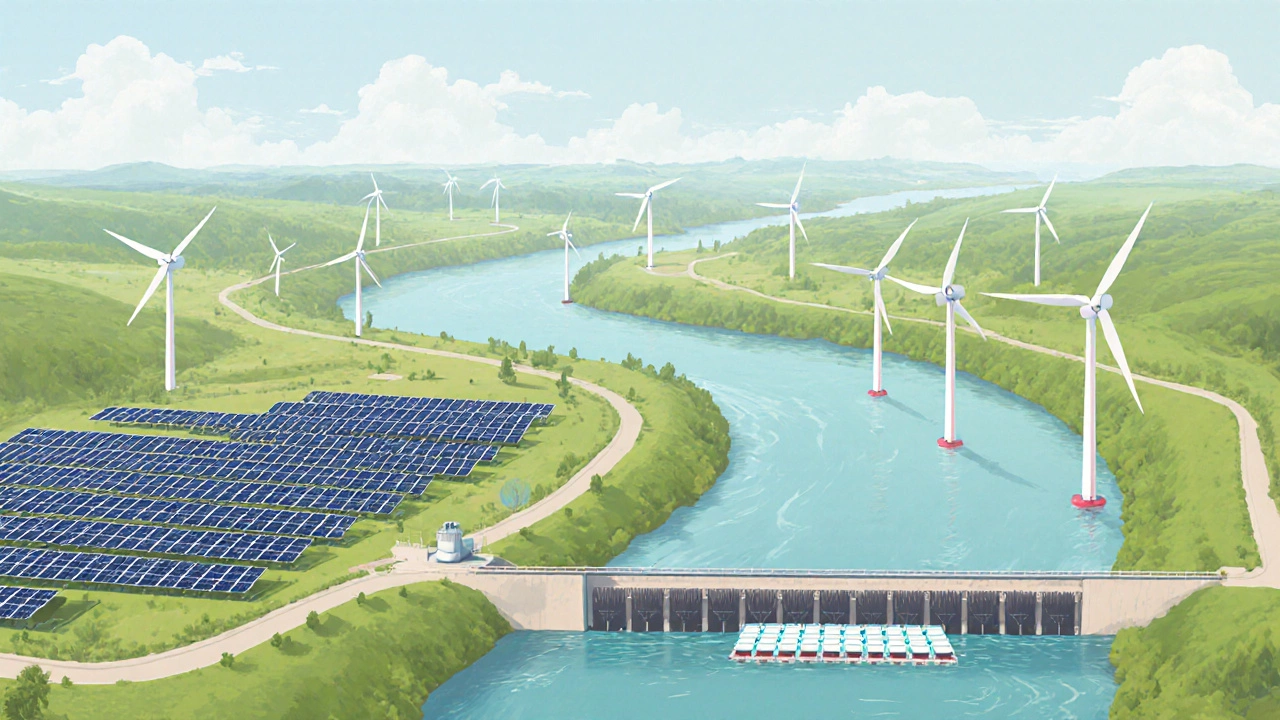
Putting It All Together: Which Renewable Is the Most Polluting?
Based on the latest peer‑reviewed LCAs, the hierarchy from highest to lowest average lifecycle pollution looks like this:
- Poorly managed Biomass Energy (especially when sourced from deforested land)
- Large‑scale Hydropower in tropical or highly organic reservoirs
- Concentrated Solar‑Thermal (high water use)
- Solar Photovoltaic, Onshore Wind, and Geothermal (lowest emissions)
So, the answer to the headline question is: **Biomass energy, when sourced unsustainably, is generally the most polluting renewable.** Large dams follow closely, especially in methane‑rich contexts.
How to Reduce Pollution from the “Dirty” Renewables
If a region relies heavily on biomass or big dams, there are practical steps to cut their impact:
- Switch to sustainable feedstock: Use agricultural residues, waste‑derived pellets, or fast‑growing energy crops grown on marginal lands.
- Improve combustion efficiency: Modern gasifiers and combined‑heat‑and‑power (CHP) plants can shave 30‑40 % off CO₂ emissions.
- Deploy small‑scale, run‑of‑river hydropower: These avoid large reservoirs and the associated methane.
- Integrate methane capture: Some dam operators install floating covers or bio‑filters to trap released CH₄.
- Hybridize with low‑impact renewables: Pairing biomass with solar or wind smooths supply while letting the cleaner tech do most of the energy generation.
Quick Checklist for Decision‑Makers
- Ask for a full Lifecycle Assessment before approving new projects.
- Prioritise technologies with CO₂e < 30 g/kWh for new builds.
- Scrutinise any biomass proposal for land‑use change and supply‑chain emissions.
- Evaluate dam sites for methane‑generation potential using local temperature and organic‑matter data.
- Consider retrofitting existing hydro‑sites with turbine upgrades instead of building new dams.
Frequently Asked Questions
Why does biomass sometimes emit more CO₂ than a coal plant?
If the biomass comes from recent forest clearing, the carbon stored in those trees is released instantly when burned, while the new trees that will re‑absorb the CO₂ take decades to grow. The net effect can be a higher carbon debt than mining and burning coal, especially when transport and processing emissions are added.
Can hydropower ever be truly carbon‑neutral?
Run‑of‑the‑river schemes that avoid large reservoirs produce negligible methane and can be carbon‑neutral. The key is to minimise flooded area and keep water temperatures low.
How reliable are lifecycle emission numbers?
LCAs rely on data quality, regional specifics, and assumptions about technology maturity. Peer‑reviewed studies from reputable bodies (IEA, IPCC, WRI) are the most trustworthy, but always check the scope and boundary conditions before using the numbers for policy.
Is solar still better for the environment if we use rare‑earth metals?
Modern PV panels now use far less silver and rely on abundant silicon. Recycling programs are emerging to recover metals, making solar one of the cleanest options when assessed over its full lifetime.
What role does water consumption play in renewable choice?
Water‑intensive technologies (like concentrated solar‑thermal or some hydro projects) can strain scarce resources in arid regions. Choosing low‑water options-photovoltaic panels or wind turbines-helps preserve water for agriculture and drinking.