Has Temperature Risen in the Last 100 Years? The Data Behind Global Warming
 Sep, 29 2026
Global Temperature Anomaly Explorer
Explore the approximate annual global temperature anomalies (deviation from the 20th-century average) based on aggregated scientific data. Hover over the bars to see specific years and values.
Anomaly: --°C
You might remember your grandparents talking about winters that were actually cold enough to freeze ponds solid. Or maybe you recall news headlines from a few decades ago claiming we were heading into an ice age. So, when scientists say Global Temperature is rising, it can feel like just another scary headline rather than a measurable fact. But has the temperature actually risen in the last 100 years? The short answer is yes, and by a significant margin. The long answer involves looking at billions of data points collected from thermometers, ships, satellites, and even tree rings.
The Raw Numbers: What Does "Rising" Actually Mean?
When meteorologists talk about global warming, they aren't referring to how hot it felt on your street last Tuesday. They are talking about the average surface temperature of the entire planet. According to major scientific bodies like NASA and NOAA, Earth's average surface temperature has increased by about 1.1 degrees Celsius (2 degrees Fahrenheit) since the late 19th century. That sounds tiny, right? A degree or two doesn't seem like much when you're deciding what jacket to wear. But for the entire planet, this shift is massive. It’s like having a low-grade fever that never goes away. Most of this warming has happened in the last 40 years, with the seven warmest years on record all occurring since 2015.
This isn't just one agency saying one thing. Multiple independent datasets-some going back over 150 years-show the same upward trend. Whether you look at land-based station data, ocean buoys, or satellite measurements, the trajectory is unmistakably up. The key takeaway here is consistency. Different methods, different instruments, and different teams of scientists have all arrived at the same conclusion: the world is getting hotter.
How Do We Know? The Science of Measuring History
You might wonder how we know temperatures from 1926, let alone 1850. Before digital sensors, humans used mercury thermometers. Thousands of them, placed in cities, rural towns, ships, and research stations worldwide. These records go back to the mid-1800s. But what about before that? Scientists use Paleoclimatology, which is essentially detective work using nature's archives.
- Tree Rings: Trees grow wider rings in warm, wet years and thinner rings in cold, dry ones. By analyzing thousands of trees, scientists can reconstruct temperature patterns for centuries.
- Ice Cores: Drilling deep into Antarctic and Greenland ice sheets traps air bubbles from ancient atmospheres. This tells us not just the temperature, but exactly how much CO2 was in the air at that time.
- Sediment Layers: Ocean floor sediments contain fossils of microscopic organisms whose chemical composition changes based on water temperature.
These natural records confirm that current temperatures are outside the range of natural variability seen in the last millennium. The Medieval Warm Period, often cited by skeptics, was regional and less intense than today's global warming. Today's heat is planetary and accelerating.
| Method | Time Range Covered | Primary Indicator | Limitations |
|---|---|---|---|
| Thermometer Stations | ~1850-Present | Air/Water Surface Temp | Urban Heat Island effect; uneven global coverage |
| Satellites | 1979-Present | Lower Atmosphere Temp | Short timeline; orbital drift corrections needed |
| Tree Rings | Thousands of years | Growth Width/Density | Indirect measure; affected by rainfall too |
| Ice Cores | Hundreds of thousands of years | Oxygen Isotopes/Gas Bubbles | Limited to polar regions; expensive to extract |

Is It Just Natural Cycles?
Earth's climate has always changed. Volcanoes erupt, the sun varies in intensity, and the planet wobbles on its axis (Milankovitch cycles). These factors cause ice ages and warm periods. So, why blame humans? Because natural forces alone cannot explain the rapid spike in the last century. If you simulate the climate using only solar activity and volcanic eruptions, the model predicts a slight cooling trend since 1950. When you add human-caused greenhouse gases, the model matches the observed warming perfectly.
The primary driver is Carbon Dioxide (CO2). Burning fossil fuels releases carbon stored underground for millions of years into the atmosphere in just a few centuries. CO2 acts like a blanket, trapping heat that would otherwise escape into space. Since the Industrial Revolution, atmospheric CO2 levels have jumped from around 280 parts per million (ppm) to over 420 ppm. This is the highest concentration in at least 800,000 years. There is no natural cycle that dumps this much carbon into the sky so quickly.
What Are the Visible Signs?
If the thermometer data feels abstract, look at the physical world. The evidence of rising temperatures is visible in three major areas: oceans, ice, and seasons.
Ocean Heat Content: About 90% of the excess heat trapped by greenhouse gases ends up in the ocean. This causes thermal expansion-water expands as it warms-which is a major contributor to Sea Level Rise. Coastal communities in places like Florida and Bangladesh are already dealing with higher tides and more frequent flooding, not because of storms, but because the baseline water level is higher.
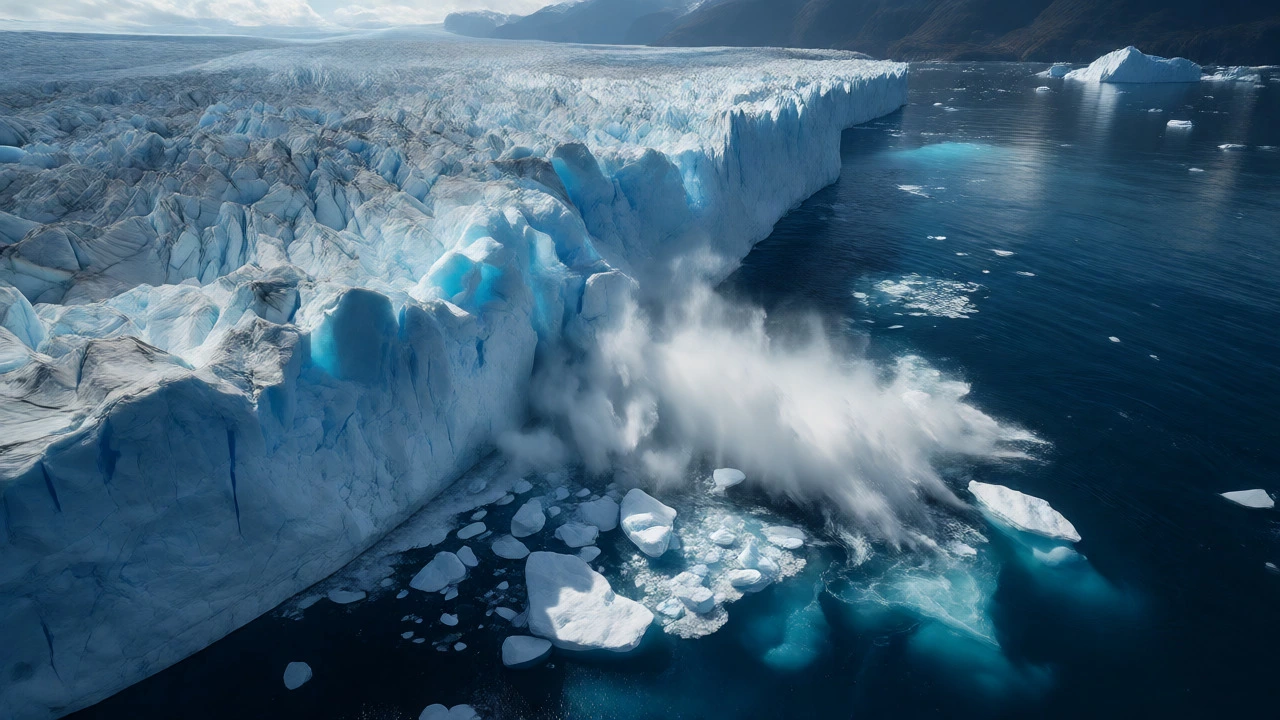
Melting Ice: Glaciers are retreating almost everywhere on Earth. In the Arctic, sea ice extent has shrunk dramatically in summer months. Satellite images show a clear reduction in ice cover compared to the 1980s. This matters because white ice reflects sunlight, while dark ocean absorbs it. Less ice means more heat absorption, creating a feedback loop that accelerates warming.
Shifting Seasons: Spring arrives earlier in many parts of the Northern Hemisphere. Flowers bloom sooner, insects emerge earlier, and birds migrate at different times. This mismatch can disrupt ecosystems. For example, if caterpillars hatch before their bird predators arrive, both populations suffer. Farmers also notice longer growing seasons, but also more extreme droughts and unpredictable rainfall patterns.
Why Does This Matter for You?
You don't need to be a scientist to feel the impact. Rising temperatures affect health, economy, and daily life. Heatwaves are becoming more frequent and intense. In cities like Liverpool, London, or New York, urban heat islands make these effects worse, leading to higher energy costs for air conditioning and increased risk of heat-related illnesses, especially among the elderly and children.
Agriculture faces uncertainty. While some northern regions might benefit from longer growing seasons, others face crop failures due to drought or heat stress. Insurance premiums are rising in flood-prone areas. Supply chains get disrupted by extreme weather events. The cost of doing nothing is far higher than the cost of transitioning to cleaner energy sources.
Moreover, the debate isn't really about whether it's happening anymore. The scientific consensus is overwhelming. Over 97% of actively publishing climate scientists agree that human activities are causing global warming. The real question now is how fast we can adapt and mitigate further increases. Every fraction of a degree matters. Keeping warming below 1.5°C versus 2°C makes a huge difference in how many coral reefs survive and how severe coastal flooding becomes.
Common Misconceptions
People often confuse weather with climate. A cold winter doesn't disprove global warming. Climate is the average pattern over decades; weather is what happens day-to-day. Another myth is that scientists disagree. While there are debates about the exact sensitivity of the climate to CO2, the fundamental fact of anthropogenic warming is settled science. Finally, some argue that CO2 is plant food. It is, but plants need water and nutrients too, and excessive heat stresses them out, reducing yields despite more CO2.
Has the Earth's temperature risen in the last 100 years?
Yes. According to data from NASA, NOAA, and other international agencies, Earth's average surface temperature has risen by approximately 1.1 degrees Celsius (2 degrees Fahrenheit) since the late 19th century. Most of this warming has occurred in the past 40 years, making it unprecedented in recent geological history.
How do scientists measure temperature changes from 100+ years ago?
Scientists use direct thermometer records dating back to the mid-1800s for recent history. For older periods, they rely on proxy data such as tree rings, ice cores, sediment layers, and coral growth patterns. These natural archives preserve chemical and physical indicators that correlate with historical temperatures.
Is global warming caused by humans or natural cycles?
While natural cycles influence climate, they cannot account for the rapid warming seen in the last century. Models that include only natural factors (like solar activity and volcanoes) predict cooling or stable temperatures. Only models that include human-emitted greenhouse gases match the observed temperature rise.
Does a cold winter disprove global warming?
No. Weather refers to short-term conditions, while climate is the long-term average. Global warming shifts the baseline, but individual days or seasons can still be cold. In fact, a warmer Arctic can sometimes lead to colder air spilling southward, causing harsh winters in specific regions even as the global average rises.
What is the main gas responsible for recent temperature rise?
Carbon dioxide (CO2) is the primary driver of recent global warming. Atmospheric CO2 concentrations have increased from about 280 parts per million (ppm) before the Industrial Revolution to over 420 ppm today, primarily due to burning fossil fuels like coal, oil, and gas.